
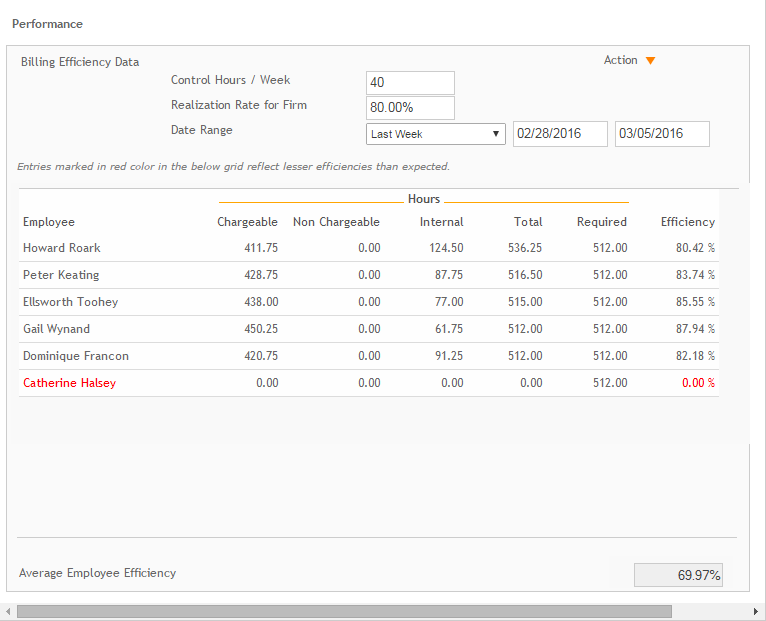
Performance data enables administrators to measure the employees billing efficiency. This screen shows each active and non-overhead employee’s billable hours and efficiency for a specified date range. This is compared to the Control Hours/Week and Efficiency Threshold for Firm. You can have employees whose efficiency can be less due to greater administrative responsibilities.
Control Hours / Week:
Enter the typical number of hours your employees work per week.
Realization Rate for Firm:
Enter your minimum efficiency percentage goal. Your efficiency is the ratio of recorded billable hours to required hours.
Date Range:
Specify the date range for which you want to view billing efficiency data.
Grid:
This grid displays the chargeable, non-chargeable, internal, total and required hours for listed employees for the specified date range. It also displays their efficiency percentage. Employees with efficiency percentages that fall short of the value in the Efficiency Threshold for Firm field display in red.
 Click a grid a column header to sort the information by the content in
that column.
Click a grid a column header to sort the information by the content in
that column.
Action
Refresh:
Select this option to update the grid data after updating the control hours, efficiency threshold or data range values.
Print:
Select this option to print the displayed billing efficiency data.
Average Employee Efficiency:
This read-only field displays the average efficiency ratio for your firm's employees.
Button Panel
Save:
Stores your settings.
Help:
Opens the ArchiOffice Help in the Preferences section.